ABSTRACT
biologically accurate aerodynamic test models mimicking the slotted primary feather geometry of the Brown Pelican (Pelecanus occidentalis). Preserved examples of both a full Brown Pelican wing and a single primary feather were 3D scanned and digitally reconstructed using a combination of MATLAB and CAD software. The final model was then 3D printed as a collection of smaller components using a LulzBot TAZ 6 printer and Taulman3D T-Glase PET filament. After using various surface finishing techniques to improve the finish of all 3D printed parts, an assembly was designed to mount the model in the low speed wind tunnel at the California Polytechnic State University.
Prior to aerodynamic testing, airfoil sections of the pelican wing were generated in CAD and several common airfoil measurements and characteristics were investigated. At a flow velocity of 5 m/s (Re ~1.21 x 10⁵), wind tunnel smoke and laser visualization testing highlighted the vortex generation of multiple primary feathers, as well as large-scale flow deviations in the vicinity of the feathers. A total pressure rake and total pressure probe were used to create detailed plots of the ratio of the local velocity to free-stream velocity (Vx/Vx∞) at two planes downstream of the model, which revealed vortex positioning consistent with that predicted by smoke visualization testing and provided a metric by which to evaluate the relative strength of each vortex.
The model creation process and wind tunnel testing results outlined here provide a strong foundation for future investigations into the potential aerodynamic benefits provided by the slotted primary feather geometry employed by the Brown Pelican and other large gliding avian species.
THE BROWN PELICAN
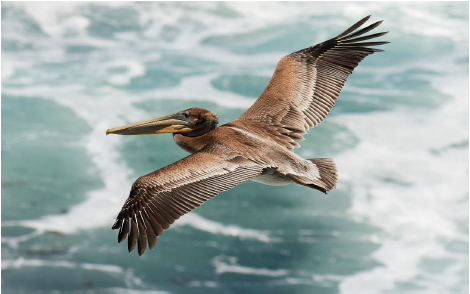
Figure 1. A juvenile Brown Pelican in flight near Bodega Bay, California.
The Brown Pelican (Pelecanus occidentalis) is the smallest of the eight pelican species contained in Family Pelecanidae. In accordance with the species name occidentalis (Latin for “of/pertaining to the west”), the Brown Pelican is typically found in the western hemisphere along the coasts of North and South America. Though once endangered due to the use of organochlorine pesticides in North America, Brown Pelicans are now a relatively common sight along coastal areas.
While awkward on land, the large wingspan of this bird (typically ranging from 1.8 to 2.5 m for males) permits efficient flight to and from feeding areas as well as breeding grounds, which are often located on small, uninhabited offshore islands. As foraging may occur up to 75 km from the nest, Brown Pelicans spend a significant amount of time airborne. Overall lengths of male specimens can range from 1.0 to 1.4 m, whereas total weight may vary anywhere from 2.0 to 5.0 kg. Females are somewhat smaller than males with wings that are approximately 3-6% shorter.
AERODYNAMIC THEORY AND THE WINGLET
Modern winglets can vary significantly in size and shape depending on the needs of the specific aircraft. Regardless, the goal of each winglet remains the same: to reduce the induced drag generated by the wing and increase the efficiency of the aircraft. This is generally accomplished by modifying the effective aspect ratio without significantly increasing the span of the wing. Winglets offer improved efficiency without the need to lengthen the wing, which would require additional reinforcement of the wing structure and increase the total weight of the aircraft, further increasing the fuel burn. A collection of several modern winglet designs are presented below.
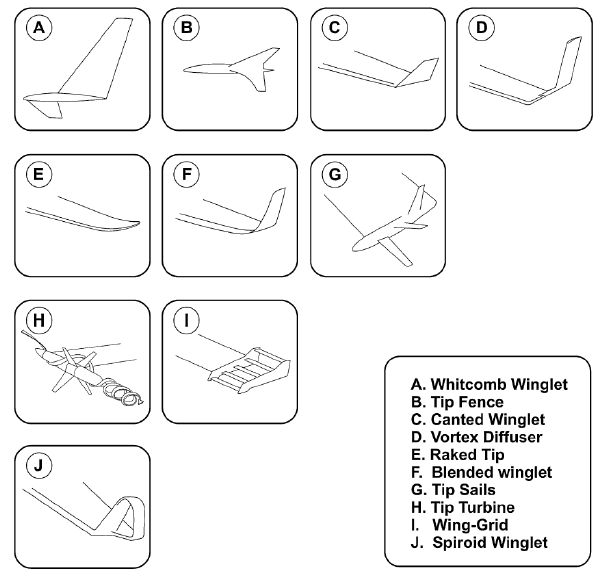
Figure 4. A sample of modern winglet designs.
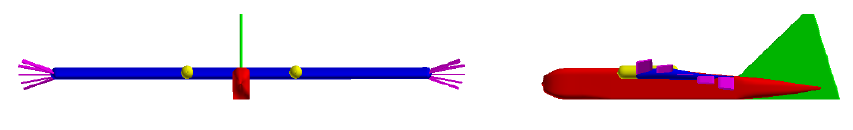
Figure 5. Dragon Eye UAV with cascading winglet geometry investigated by Shelton et al.
Approaches using numerical optimization techniques have also yielded some degree of success. During a study of wing tip geometries on the U.S. Marine Corps Dragon Eye UAV using a panel method code that approximated each winglet as a flat plate, Shelton et al. discovered that the addition of distributed winglets did in fact increase the range and endurance of the UAV. However, it was noted that this depended strongly on the length and positioning of each winglet, as well as the flight conditions.
AVIAN MORPHOLOGY
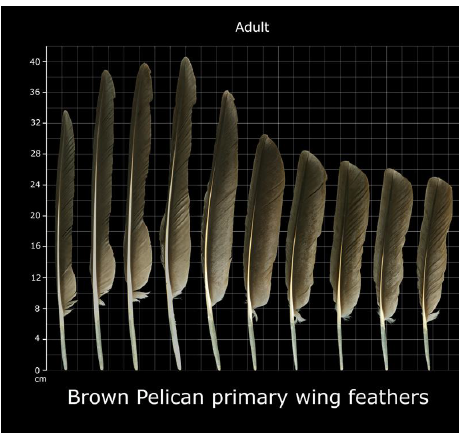
Figure 6. Morphology of the primary feathers of a Brown Pelican in order from the leading edge (left) to the trailing edge (right) of the right wing.
Mature Brown Pelicans typically have 10 primary feathers at the tip of each wing. Figure 6, generated by the United States Fish and Wildlife Service, presents the overall size and shape of each of these primary feathers. Of particular note are the distinctly slimmer and elongated feathers present near the wing’s leading edge, as well as the asymmetric positioning of the shaft in each feather.
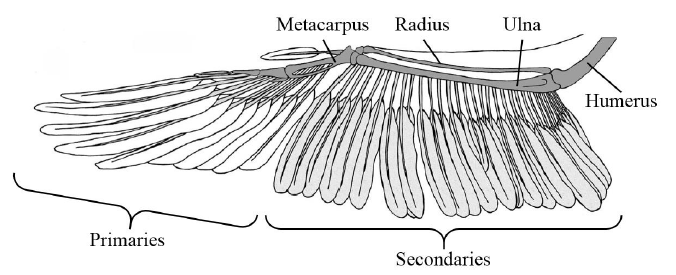
Figure 7. Overview of the Brown Pelican wing structure presented by Simons et al. Labels have been added for clarity.
Despite the large number of wing muscles, the area between the shoulder and wrist joints is occupied by a collection of tendons only, which pushes the maximum thickness of the wing further aft. An overview of the skeletal structure and flight feather groups of a Brown Pelican wing is presented in Figure 7.
DIGITAL MODEL CREATION

Figure 8. Project workflow overview.
The body of work for this research project was separated into two primary components: the establishment of a process allowing the creation of biologically accurate models suitable for aerodynamic testing and the implementation of this process to characterize the flow field downstream of an example model. An overview of the project workflow is presented in Figure 8.
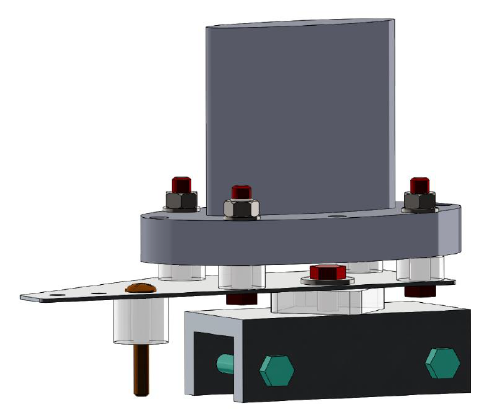
Figure 18. Mounting assembly overview with linear drive mounting plate shown (top).
A mounting assembly was designed to mount the test model to the wind tunnel linear drive. An overview of the mounting assembly is presented in Figure 18. A 1.6 mm thick sheet metal adapter plate was designed to act as an interface between the test model and the linear drive mounting plate. Four M8 bolts attached the adapter plate to the linear drive mounting plate. Four 3D printed cylindrical T-Glase spacers were used to provide clearance for the main M8 pivot bolt and the pivot washer.
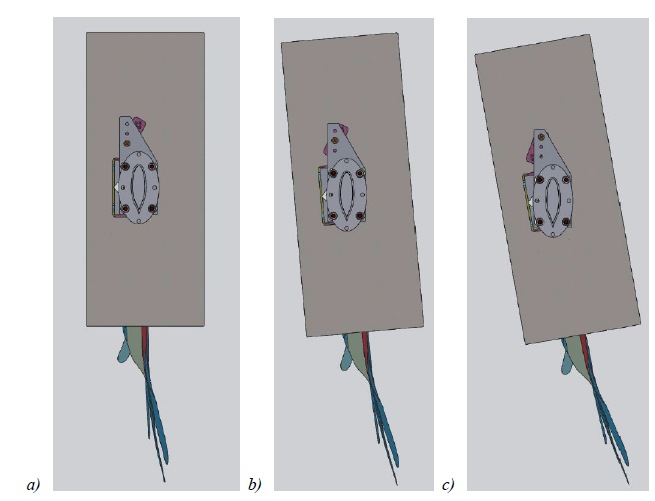
Figure 19. Overview of the final model at a) 0º, b) 5º and c) 10º angle of attack. Air flow is from top to bottom.
A pattern of three holes at the forward end of the mounting plate were used to control the model’s angle of attack. A single ¼-28 pan head machine screw was used as a pin to align the mounting plate hole with its respective hole in the model to select 0°, 5° or 10° angle of attack. During testing, the machine screw was held in place and faired over using aluminum tape. A 3D printed T-Glase spacer was also used at this location to help align the model and prevent rocking during testing. Figure 19 presents a top-down view of the model at each angle of attack.
AERODYNAMIC TEST MODEL CREATION
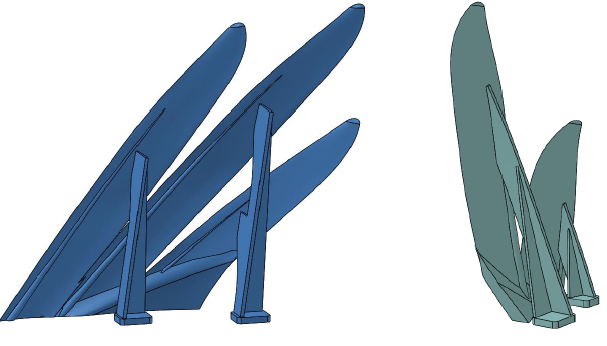
Figure 21. Detail views of the support structures designed for each feather component.
For components requiring extra support during the 3D printing process, either due to overhangs or poor structural rigidity (e.g. feather components), a series of support structures was designed. Each structure featured a 1 cm tall square base with rounded corners, which provided a solid foundation for the structure and ensured proper adhesion to the print bed. Above the foundation, truss-like structures supported the component as necessary. These were tapered to provide sufficient support while minimizing print time and material usage. Figure 21 provides an overview of the support structures designed for the feather components.
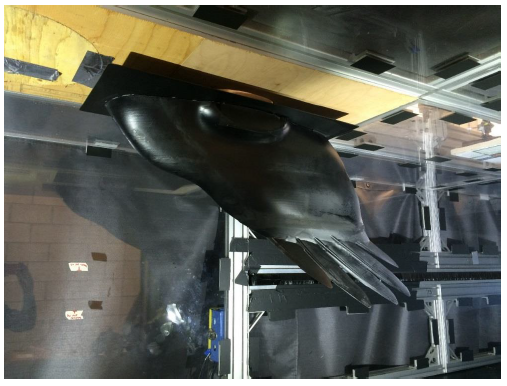
Figure 22. Final aerodynamic test model mounted in the Cal Poly low speed wind tunnel. Side View.
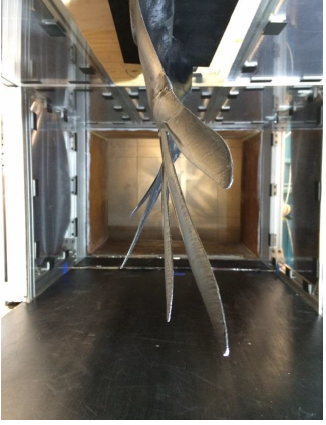
Figure 23. Final aerodynamic test model mounted in the Cal Poly low speed wind tunnel. Rear view.
Figures 22 and 23 present an overview of the final assembly mounted in the low speed wind tunnel. Assembly drawings detailing the main assembly and each of the three subassemblies can be found in Appendix B. A complete Bill of Materials is included in each assembly drawing for reference.
EXPERIMENTAL APPARATUS AND SETUP
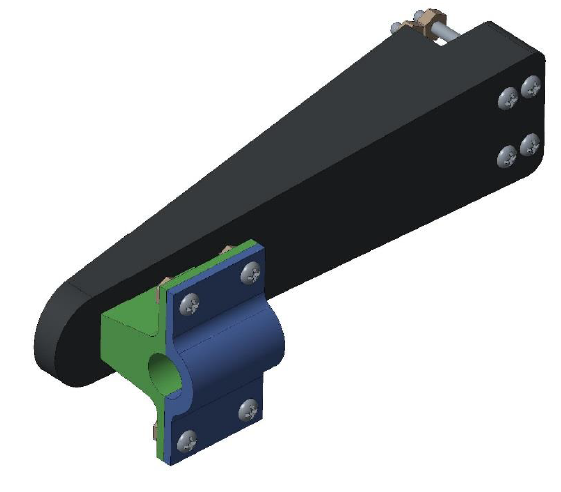
Figure 28. Measurement device mounting assembly.
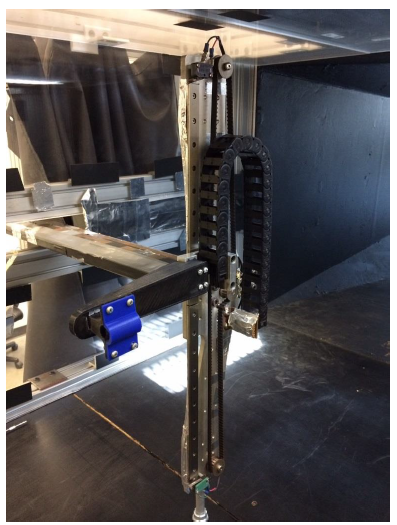
Figure 29. Overview of the traverse system with no measurement devices mounted.
The cap was secured in place using a series of four #8-32 x 0.5 in machine screws and nylon insert nuts, while the entire assembly was mounted to the traverse arm using four #8-32 x 2.0 in machine screws and nylon insert nuts. Figure 28 presents an overview of the assembly in Creo Parametric, while Figure 29 shows the assembly mounted to the traverse arm.
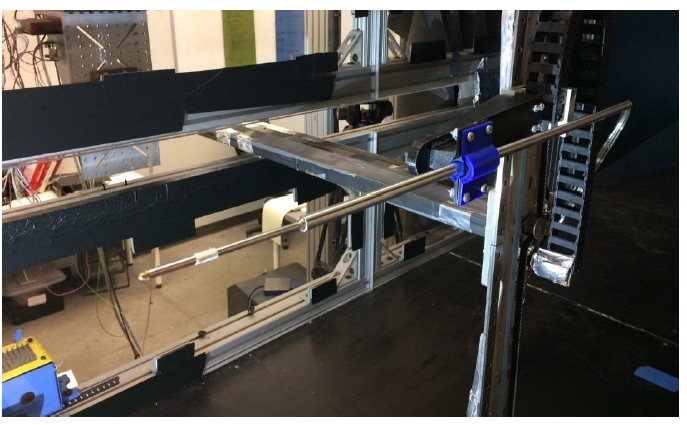
Figure 33. Total pressure probe setup.
Subsequent pressure testing was carried out using the total pressure port of a five-hole probe, a standard instrument in aerodynamic testing. When properly calibrated, a five-hole probe is capable of resolving both the speed and direction of a flow in real time. In this case, while the pressure readings from all five pressure ports were recorded during testing, only the total pressure data collected by the center port was utilized during analysis due to the lack of an existing calibration matrix for the remaining ports. As such, only the flow velocity along the axis of the wind tunnel could be resolved during testing.
EXPERIMENTAL PROCEDURE
Design of Experiments
For a wind tunnel experiment to accurately replicate flight conditions, the Reynolds number and the Mach number must match those of the original conditions. These values are defined as follows:
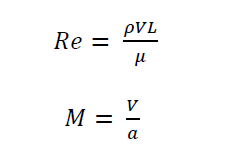
where ρ is the fluid density, V is the velocity of the fluid with respect to the object in question, L is the characteristic length, μ is the dynamic viscosity of the fluid and a is the local speed of sound. The Reynolds number describes the ratio of inertial forces to viscous forces in a fluid flow, whereas the Mach number is the ratio of the flow velocity to the local speed of sound. Both the Reynolds number and Mach number are dimensionless parameters.
RESULTS AND DISCUSSION
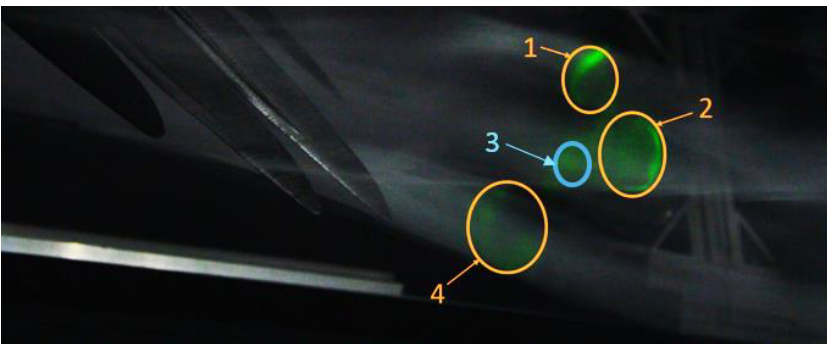
Figure 41. Still frame detailing relative size and location of vortices downstream of the test model. Flow velocity 5 m/s, angle of attack 10°.
Each of these three vortices held a relatively fixed position in space and was found to persist throughout the duration of the experiment. An additional vortex (vortex 3) suggested by subsequent pressure testing is also presented in Figure 41, though both the strength and positioning of this vortex structure appeared to be somewhat inconsistent during the visualization process and it is noted here for reference only.
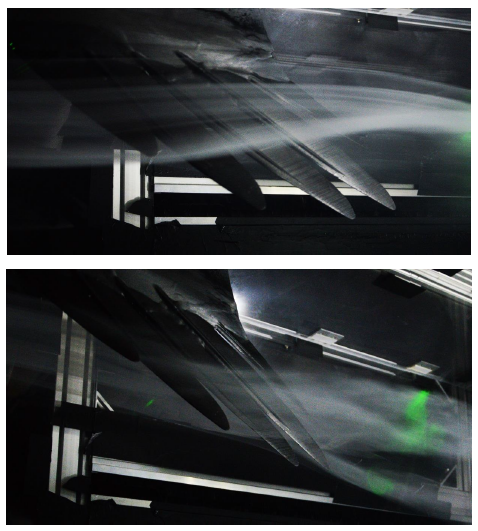
Figure 43. Flow deflection around the primary feathers. Side view.
In this case, the low flow velocity allows the effects of this gradient to be visible in the vicinity of the wing itself as opposed to further downstream. Additionally, each primary feather is likely to be deflecting the flow either inboard or outboard based on the relative angle between the plane of the wing and the feather. Figure 43 details the flow deflections above and below the wing.
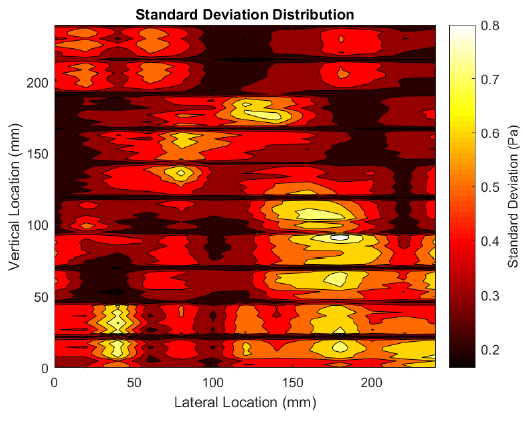
Figure 50. Contour plot of the standard deviation of each data sample collected by the total pressure rake.
In an effort to quantify the amount of potential error during the sampling process, the standard deviation of the 100 data points sampled by each port at each sampling location was calculated. The resulting contour plot of the standard deviation throughout the flow field for the test utilizing the total pressure rake is presented in Figure 50.
CONCLUSIONS AND RECOMMENDATIONS
A novel process to develop the most biologically accurate model of a slotted primary feather geometry constructed to date was investigated and defined using a combination of 3D scanning, 3D printing and CAD technologies. To test the derived process, an aerodynamic test model was successfully created and tested in the Cal Poly low speed wind tunnel at a flow velocity of 5 m/s and wing angle of attack of 10°. Flow characterization was carried out using a combination of smoke and laser visualization coupled with total pressure rake and total pressure probe testing.
Before beginning testing, characterization of several airfoil sections generated using 3D scan data of a Brown Pelican wing was carried out. The resulting measurements were compared to an existing study detailing the morphology of the Australian Pelican (Pelecanus conspicillatus). While several discrepancies did exist, the resulting measurements correlated well with the results of the prior study and with published literature detailing the skeletal and muscular layout of the wings of Brown Pelicans, providing a high degree of confidence regarding the representativeness and veracity of the preserved Brown Pelican wing. However, the specimens compared here should not be assumed to be wholly representative of both pelican species, but rather two distinct individuals. Additional studies will need to be conducted to obtain more average measurements and airfoil sections for comparison.
Flow visualization at a distance of 0.2 m downstream of the model revealed that vortices were created by multiple feather tips as expected. In addition, a large-scale pressure gradient caused by the generation of high pressure under the wing and lower pressure over the wing caused the airflow above the primary feathers to curve inboard towards the wing root, while the flow below the feathers was simultaneously deflected outwards. This visualization testing provided invaluable data and provided crucial information that was used to clarify results suggested by later pressure tests.
Source: California State Polytechnic University
Authors: David S. Martin
>> 200+ Matlab Projects based on Control System for Engineering Students
>> More Matlab Mini Projects for Final Year Students